Sustainable Development Goal Index

Sustainable
Development Goal Index
Introduction
Sustainable
development aims to meet the needs of the present generation without
threatening the ability of future generations to meet their own needs. It
provides a framework which brings together economic, social and environmental
consideration. These aspects are interrelated to each other and are necessary
for the well-being of society as a whole and an individual.
United
Nations Sustainable Development Agenda 2030 was adopted by world leaders in the
year 2030. The SDGs for 2030 evolved from Millennium Development Goals (MDGs)
for 2015. SDGs have been formulated considering the output from a series of
conferences conducted on the crucial status of environmental stability. India
played an important role in the formulation of 17 sustainable development
goals. In this agenda of sustainable development goals, there are 17 Goals, 169
Targets which contain 306 National Indicators. (United
Nations & Niti , 2018)
These
17 goals mentioned by United Nations mainly focus on following parameters: No
Poverty: Eradication of poverty from in all its forms. In the last few decades
no of peoples living in extreme poverty declined from 36% in 1990 to 10% in
2015. But the recent pandemic is feared to have increased this percentage
again. By 2030 UN targets to reduce the poverty completely and ensure to give
equal rights to men and women to economic sources. (United
Nations, 2018)
The
other goals of sustainable development are Zero hunger, good health and well-
being, vaccination drive, quality education, gender equality, clean water and
sanitation, Affordable and clean energy, decent work and economic growth,
investment in industry, innovation and infrastructure, reduced inequalities,
sustainable cities and communities, responsible consumption and production,
climate action, careful management of water, life on land, peace, justice and
strong institutions and global partnerships. (United
Nations, 2018)

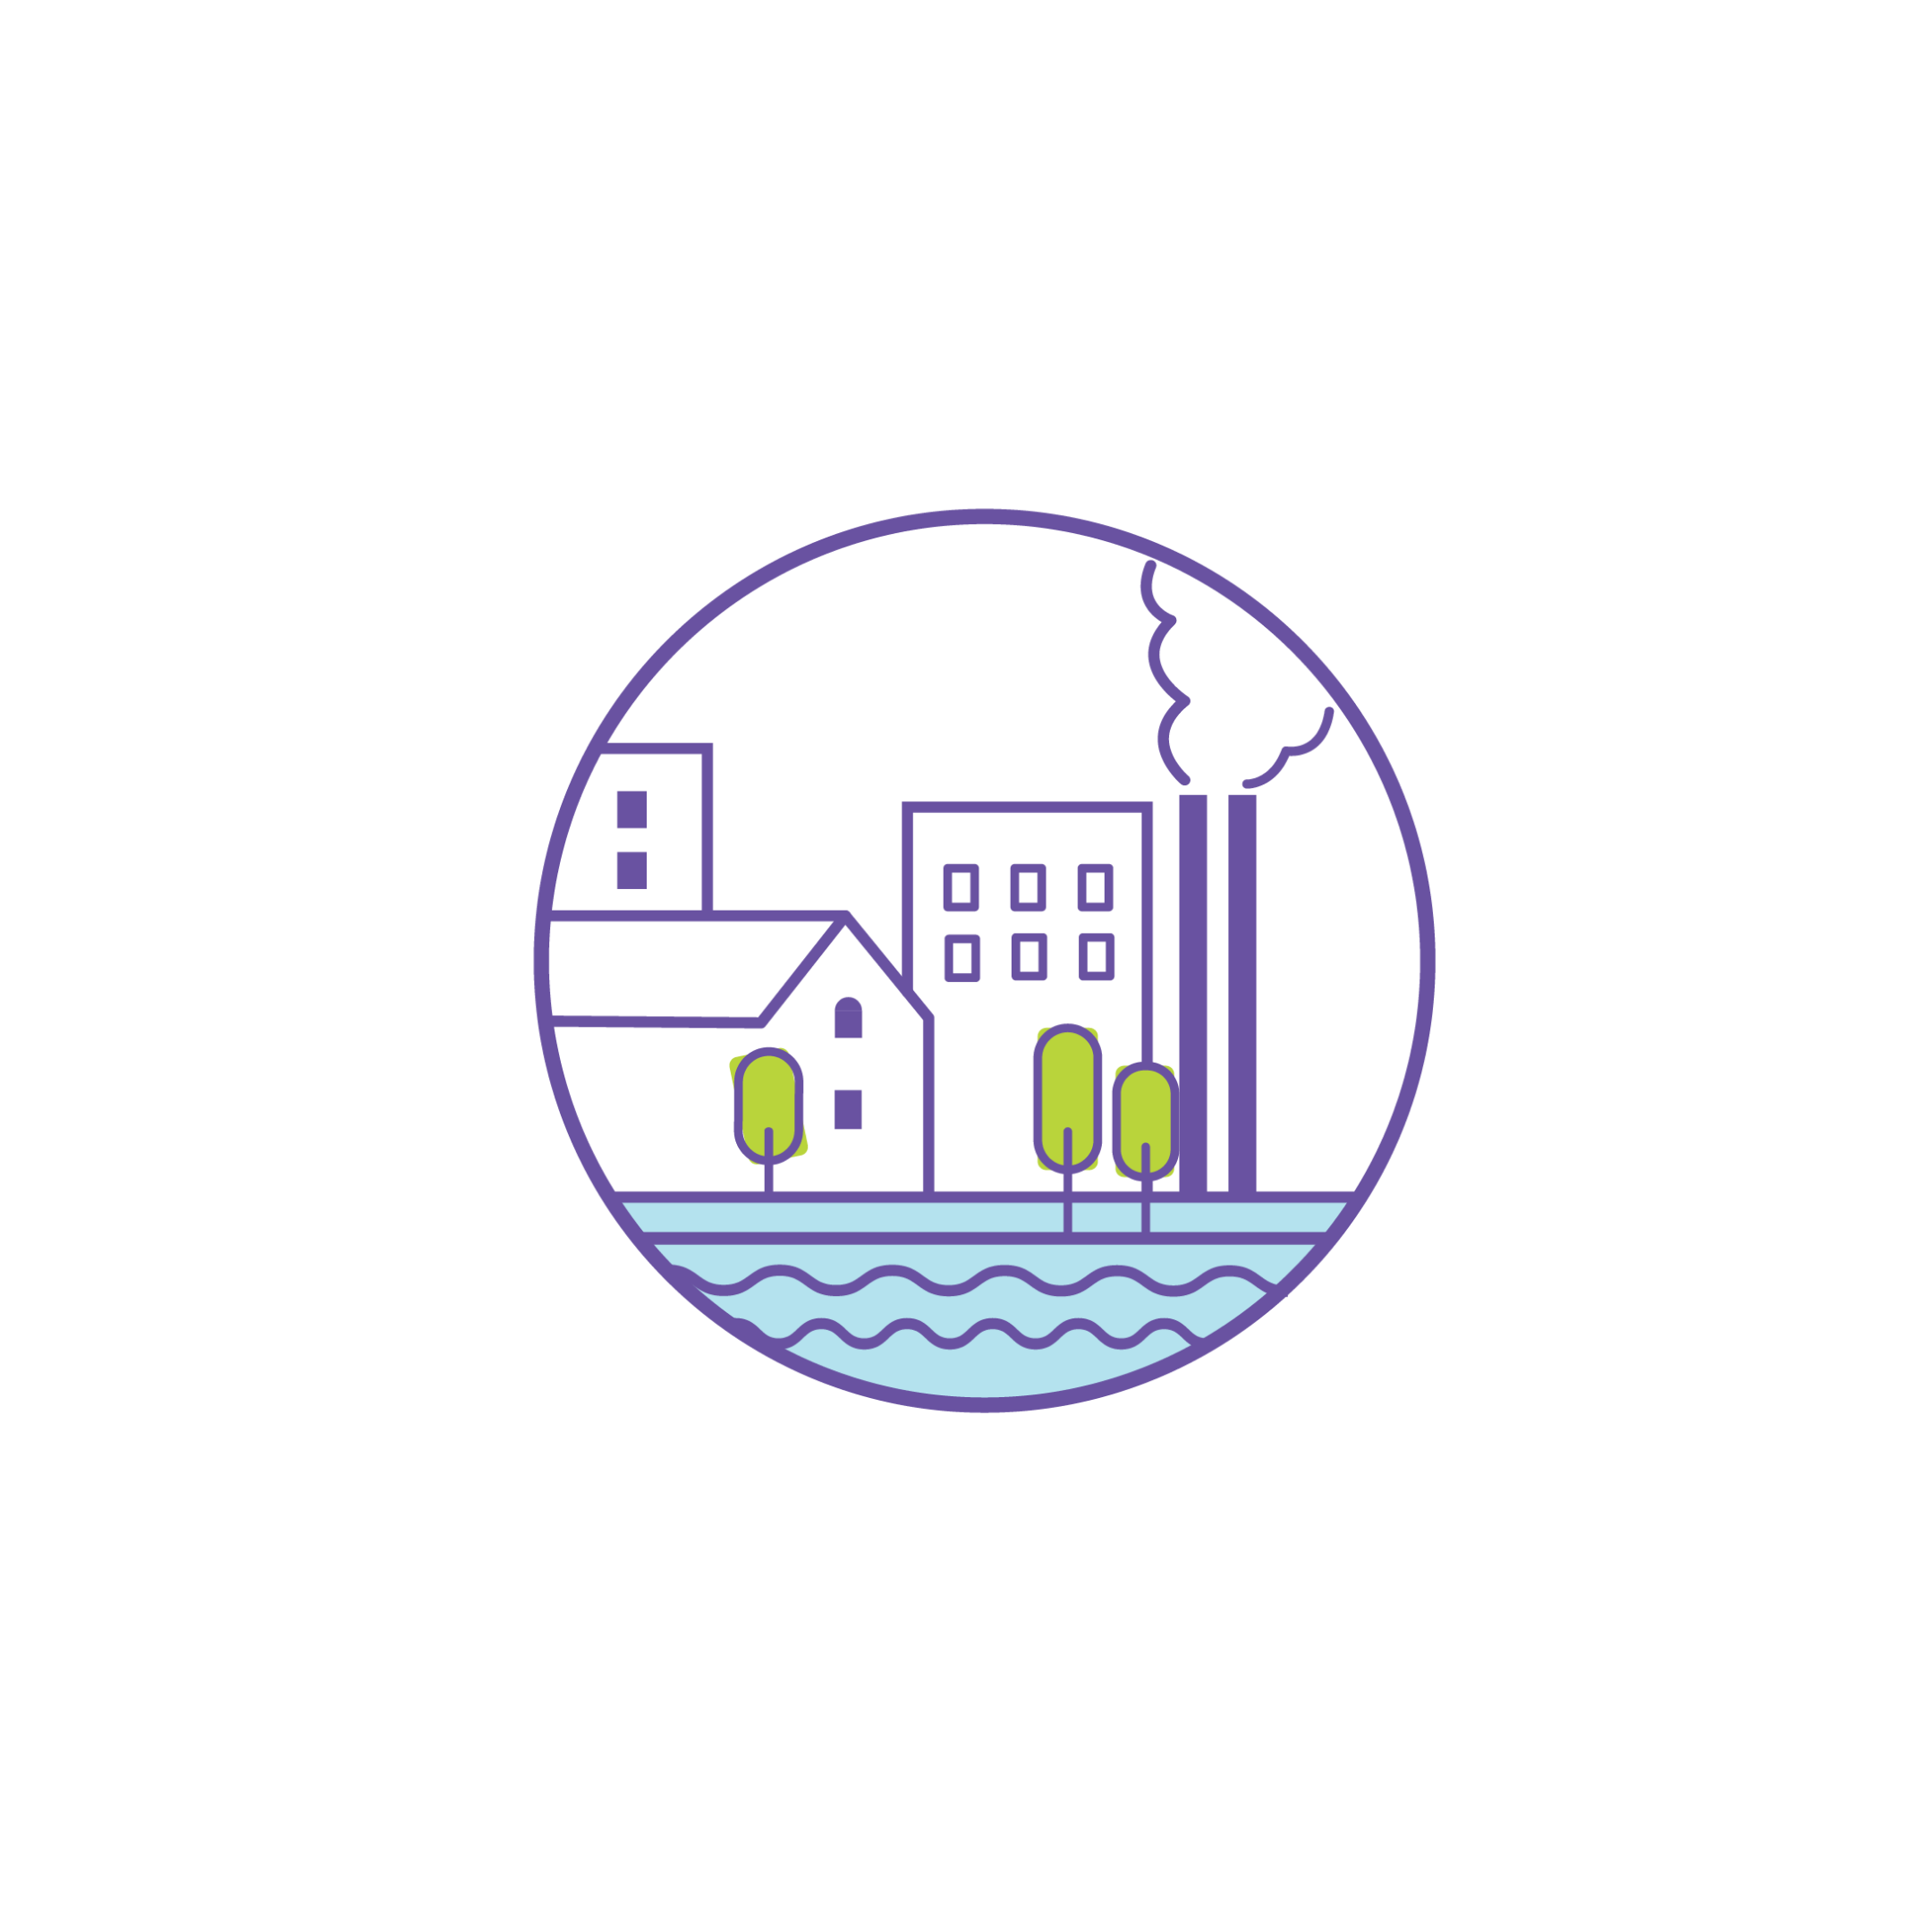
Figure
1: SDG India Index Goal
Source:
Aim
The
aim of these sustainable development goals is to provide human dignity,
regional and global stability, a healthy planet, fare and resilient societies
and prosperous economies. Achieving this objective through sustainable
development goals will help in bringing together EU countries, within societies
and with the rest of the world.
NITI
Aayog in India has formed the Sustainable Development Goals (SDG) India Index
Baseline Report in 2018. The SDG India Index shows the parameters on which
sustainable development goals will be measured in India, it also gives brief
about progress made by Indian state and union territories towards implementing
the 2030 SDG targets.
Analysis
India
is secondly populous country in the world, it is being widely agreed that India
will play a leading role in determining the relative success or failure of
SDGs. The Indian government is taking measures for issues like poverty,
sustainable growth, health, nutrition, gender equality and quality education to
achieve the SDG agenda for 2030.
NITI
Aayog has formed SDG India Index for 13 Goals and launched it in December 2018
(SDG Index 1.0). The progress of all Indian states and Union Territories was
measured on the basis of 62 National Indicators. This document briefs on achievement
of goals set by UN Sustainable Development Goals agenda, 2030 based on three
major aspects i.e. social, economic and environmental status. The document
helps in evaluating the performance, which is helpful for policymakers,
businesses, civil society and public. (United
Nations & Niti , 2018)
The
second edition of the SDG India index (SDG Index 2.0) was launched which
covered all the 17 Goals and 54 targets and launched in December 2019. It
indicated the progress of all Indian states and UTs with the help of 100
indicators. It included 68 indicators which are completely aligned with the National Indicator Framework (NIF), 20 refined
and 12 from other government sources. (United
Nations & Niti , 2019)
The
third and current SDG India Index was improved over last one and was launched
in March 2021 (SDG Index 3.0). It analysed the progress of all Indian states
and UTs based on the framework of 17 SDGs and 169 targets. The analysis of 16 goals is based on the data
on indicators while the 17th goal is qualitative assessment based. The
main objective of this index is to calculate composite score for state/UTs
based on their overall performance to achieve the goals. To highlight the best
practices within States/UTs and identify the data gaps. (United
Nations & Niti , 2021)
Multi-stakeholder partnerships will play important role in 2030 agenda for Sustainable development and Sustainable Development Goals. NITI Aayog, union ministries, State governments, UT administrations and Local governments have built up partnerships in many ways to achieve the set target. Initiatives driven by various intra and inter-governmental partnerships are as follows:
- National and sub-national consultation
- National Indicator Framework
- Voluntary national Review
- Private sector
- Research, Academia and Think Tank
- Institutional Structures
- State/UT Governments
SDG
India Index and Methodology 2020-2021
The methodology was developed in 2019 with the help of the Ministry of Statistics and Programme implementation (MoSPI), Data and Methodology Committee and UN Secretary General.
1)Selection of Indicators:
Relevant indicators to SDG are selected from the National Indicator Framework. NITI Aayog has formed 115 indicators. Data availability of various States/ UTs is checked, it is ensured that the data for at least 50% of States/UTs is available. If the suitable States/UTs data is not available for National Indicators the proxy indicators are used.
2) Consultation with stakeholders:
To finalise the selected indicators, comments from the primary stakeholders, namely States/UTs were received and detailed workshop was conducted with concerned authorities.
3) Summary of Indicators:
Out of total 115 indicators 75 are common to Index 2.0. 76 are completely aligned with NIF, 31 are derived from NIF and 8 indicators are brought in consultation with the ministries.
4) Target Setting:
Target for 74 indicators were adopted from the target set by UN. Target for 28 indicators were set by the Government of India. For 9 indicators target set by International standards were adopted and for indicators with no specified target the average of the top 3 states was adopted.
5) Normalisation of raw indicator values
The normalisation of indicator
values was done in standard scale of 0 to 100. For indicators where higher the
value means better performance following formula was used.

Where, x = raw data value
min(x) = minimum observed value of the
indicator in the dataset
T(x) = target value of the indicator
x’ = normalised value after rescaling
For the indicators where higher value
means lower performance the following formula were used.

Where, max(x) = maximum observed value of the indicator in the dataset
6) Computation of State/UT score
The arithmetic mean of normalised values
of all indicators under the Goal was calculated. Equal weight was assigned to
each indicator. According to the Goal score each State/UTs was classified into
four categories.

Where,
 =
Goal score for State/UT I under SDG j
=
Goal score for State/UT I under SDG j
 = Number of non-null indicators for State/UT I
under SDG j
= Number of non-null indicators for State/UT I
under SDG j
 =
Normalised value for State/UTs i indicator k under SDG j
=
Normalised value for State/UTs i indicator k under SDG j
7) Computation of composite index 3.0 score
The composite score was calculated taking
the arithmetic mean of goal score of 16 Goals, where each Goal was assigned
equal weightage. States/UTs were again classified into four categories based on
their composite score.

Where,
 = Composite SDG index score of State/UT i
 = Number of goal scores for which State/UT I
has non-null data
= Number of goal scores for which State/UT I
has non-null data
8) Categorisation of State/UTs
The States/UTs were classified into the
four categories based on their distance from the target. The classification is
as follow:
§
Achiever-
Index score equals to 100
§
Front
Runner- Index score between 65 and 99
§
Performer-
Index score between 50 and 64
§
Aspirant-
score is less than 50
It is observed that, no state is a 100 on
all 17 goals. 15 states are front runners and 13 states are in the Performer
category. In case of UTs 7 falls in the front runner category.

Figure 2: Methodology of Construction of the Index
(United Nations & Niti , 2021)
Case Study
The composite score for each State/UT for the year 2018, 2019 and 2020 was computed by aggregating their performance across the goals by taking the arithmetic mean of individual goal score. Goal- wise performance score of India has increased from 57 in the year 2018 to 60 in the year 2019 and it is 66 in the year 2020. The SDG India Index 3.0 score for the states varies between 52 and 75 and for UTs it varies between 62 and 79. Kerala ranked as the top state with a score of 75 and Chandigarh ranked as top UT with a score of 79.
Table 1: SDG Index Goal Performance of States/UTs
|
AREA |
2018 |
2019 |
2020 |
AREA |
2018 |
2019 |
2020 |
|
Kerala |
69 |
70 |
75 |
Chandigarh |
70 |
70 |
79 |
|
Himachal Pradesh |
69 |
69 |
74 |
Delhi |
61 |
61 |
68 |
|
Tamil Nadu |
64 |
67 |
74 |
Lakshadweep |
63 |
63 |
68 |
|
Andhra Pradesh |
66 |
67 |
72 |
Puducherry |
66 |
66 |
68 |
|
Goa |
61 |
65 |
72 |
Andaman & Nicobar
Islands |
61 |
61 |
67 |
|
Karnataka |
64 |
66 |
72 |
Jammu & Kashmir |
59 |
59 |
66 |
|
Uttarakhand |
64 |
64 |
72 |
Ladakh |
0 |
0 |
66 |
|
Sikkim |
58 |
65 |
71 |
Dadra and Nagar Haveli |
63 |
63 |
62 |
|
Maharashtra |
64 |
64 |
70 |
Daman and Diu |
61 |
61 |
62 |
|
Gujarat |
64 |
64 |
69 |
|
|||
|
Telangana |
60 |
67 |
69 |
|
|||
|
Mizoram |
60 |
56 |
68 |
|
|||
|
Punjab |
59 |
62 |
68 |
|
|||
|
Haryana |
56 |
57 |
67 |
|
|||
|
Tripura |
52 |
58 |
65 |
|
|||
|
Manipur |
51 |
60 |
64 |
|
|||
|
Madhya Pradesh |
55 |
58 |
62 |
|
|||
|
West Bengal |
55 |
60 |
62 |
|
|||
|
Chhattisgarh |
51 |
56 |
61 |
|
|||
|
Nagaland |
59 |
57 |
61 |
|
|||
|
Odisha |
58 |
58 |
61 |
|
|||
|
Arunachal Pradesh |
59 |
53 |
60 |
|
|||
|
Meghalaya |
49 |
54 |
60 |
|
|||
|
Rajasthan |
42 |
57 |
60 |
|
|||
|
Uttar Pradesh |
52 |
55 |
60 |
|
|||
|
Assam |
51 |
55 |
57 |
|
|||
|
Jharkhand |
50 |
53 |
56 |
|
|||
|
Bihar |
48 |
50 |
52 |
|
|||
Source: (United Nations & Niti , 2021)


|
Figure 3: SDG Index Performance of States and UTs in the Year 2018, 2019 and 2020. |
Key Issues
1) The data sources used for selected indicators are different for all States/UTs. There is need to bring the uniformity in the data collection methods, statistical methods, sampling methods, definitional issues. There is need of single source data for any given indicator to avoid discrepancies.
2) The progress of Centrally Sponsored Schemes (CSS) mapped to SDG targets, but in case of schemes which are totally sponsored by State Government fail to measure the progress. Index 3.0 suggests mapping the progress on the basis of the outcome of the scheme. It suggests replacing scheme-specific indicators with outcome indicators.
3) The latest data should be used for analysing the progress based on indicators. Many latest National level survey reports do not cover all the States/UTs hence large number of states would be left with “Null” value.
Results
|
Goal |
India Results |
Goal-wise Top States/UTs |
Targets |
|
No Poverty |
§ Six
national level indicators have been used § 21.92%
of the population were living below poverty line in 2011-12 § Index
score ranges between 32 and 86 for states and between 61 and 81 for UTs. |
Tamil Nadu, Delhi |
§ Reduce
poverty by at least half the proportion
§ To
ensure equal rights to economic resources, access to basic services, natural
resources by 2030 |
|
Zero Hunger |
§ Demands
special attention § Seven
national level indicators have been
used § Index
score ranges between 19 and 80 for States and between 27 and 97 for UTs |
Kerala, Chandigarh |
§ End
hunger § End
all forms of malnutrition § Double
the agricultural productivity § Increase
investment in rural infrastructure, agricultural research and extensive
services, technology development |
|
Good Health and Well-being |
§ Index
score ranges between 59 and 86 for States and between 68 and 90 for UTs |
Gujarat, Delhi |
§ To
reduce global maternal mortality ratio to less than 70% per 1 lakh live
births § End
the epidemics of AIDS, tuberculosis, malaria, Water borne diseases § To
prevent halve the deaths from road traffic accidents |
|
Quality Education |
§ Eleven
national level indicators have been
used § Index
score ranges between 29 and 80 for States and between 49 and 79 for UTs § The
Enrolment Ratio in elementary classes in India is 87.26% |
Kerala, Chandigarh |
§ To
provide complete free, equitable and
quality primary and secondary education § To
build educational facilities that are child, disability and gender sensitive |
|
Gender Equality |
§ Nine
national level indicators have been
used § Demands
special attention § Index
score ranges between 25 and 64 for States and between 33 and 68 for UTs |
Chhattisgarh, Andaman and Nicobar Islands |
§ To
end all forms of discrimination against all women and girls § To
eliminate all forms of violence § Provide
equal opportunities and effective participation § Achieve
the gender ratio of 950 females per 1000 males |
|
Clean Water and Sanitation |
§ 8
national level indicators have been
used § Index
score ranges between 54 and 100 for States and 61 and 100 for UTs |
Goa, Lakshadweep |
§ Give
access to safe and affordable drinking water to all § Improve
water quality § To
protect and restore water related ecosystems § To
provide the piped water supply to all population |
|
Affordable and Clean Energy |
§ Two
national level indicators have been
used § Index
score ranges between 50 and 100 for States and between 71 and 100 for UTs |
Andhra Pradesh, Goa, Haryana, Himachal Pradesh,
Karnataka, Kerala, Maharashtra, Mizoram, Punjab, Rajasthan, Sikkim, Tamil
Nadu, Telangana, Uttarakhand, Uttar Pradesh, Andaman and Nicobar Islands,
Chandigarh, Delhi, Jammu and Kashmir, Ladakh |
§ To
ensure universal access to affordable, reliable and modern energy services § To
increase the share of renewable energy § To
improve the technology for supplying modern and sustainable energy |
|
Decent Work and Economic Growth |
§ Nine
national level indicators have been
used § Index
score ranges between 36 and 78 for States and between 47 and 70 for UTs |
Himachal Pradesh, Chandigarh |
§ To
achieve at least 7% GDP growth per annum § Reduce
the proportion of unemployed youth § To
promote development oriented policies |
|
Industry, Innovation and
Infrastructure |
§ Seven
national level indicators have been
used § Index
score ranges between 24 and 72 for States and between 23 and 66 for UTs § At
the national level almost 98% targeted road connectivity has been covered
under PMGSY |
Gujarat, Delhi |
§ Develop
quality, resilient, reliable and sustainable infrastructure § To
support domestic technology development |
|
Reduced Inequality |
§ Seven
national level indicators have been
used § Index
score ranges between 41 and 88 for States and between 62 and 100 for UTs |
Meghalaya, Chandigarh |
§ To
empower and promote the social, economic and political inclusion of all § To
facilitate orderly, safe, regular and responsible migration and mobility of
people |
|
Sustainable Cities and Communities |
§ Eight
national level indicators have been
used § Index
score ranges between 47 and 99 for States and between 50 and 95 for UTs |
Punjab, Chandigarh |
§ To
provide access to adequate, safe affordable housing and basic services and
slum up gradation § To
strengthen efforts to protect and safeguard the World’s culture and Natural
heritage |
|
Responsible Consumption and
Production |
§ Seven
national level indicators have been
used § Index
score ranges between 39 and 91 for States and between 56 and 98 for UTs |
Tripura, Jammu and Kashmir, Ladakh |
§ To
implement 10-Year Framework of Programmes on Sustainable Consumption and
Production Patterns § To
reduce waste generation |
|
Climate Action |
§ Five
national level indicators have been
used § Index
score ranges between 19 and 70 for States and between 18 and 77 for UTs |
Odisha, Andaman and Nicobar Islands |
§ To
strengthen and adaptive capacity to climate related hazards and natural
disasters § To
form policies related to climate change |
|
Life Below Water |
§ Five
national level indicators have been
used § Index
score ranges between 11 and 82 for States |
Odisha |
§ To
prevent and reduce the marine pollution § To
increase the economic benefits by marine resources § Conservation
and sustainable use of oceans and their resources |
|
Life on Land |
§ Six
national level indicators have been
used § Index
score ranges between 43 and 93 for States and between 27 and 85 for UTs |
Arunachal Pradesh, Chandigarh |
§ To
ensure the conservation, restoration and sustainable of freshwater ecosystems § To
increase the financial resources for conservation of bio diversity |
|
Peace, Justice and Strong
Institutions |
§ Eight
national level indicators have been
used § Index
score ranges between 59 and 86 for States and between 46 and 86 for UTs |
Uttarakhand, Puducherry |
§ To
reduce violence and related deaths § End
abuse, exploitation, trafficking § To
develop effective and accountable institutions at all levels |
Recommendations
1) No of National indicator framework for
the goals can be increased so that the performance of State/UTs will be analysed
more accurately.
2) The performance of State/UTs in
achieving goals of zero hunger, gender equality, industry innovation and
infrastructure, climate action, life below water and life on land needs special
attention.
3) Climate change is the rising issue in all
the States/UTs in India. The integrated action plan for climate change and disaster
risk management should be formed to minimise the impact on lives. The states,
Bihar and Jharkhand and UTs Dadra and Nagar Haveli and Pondicherry should be
given special attention in forming the action plan and mitigation measures.
4) Single methodology and analysis method
should be used to collect and analyse the data in the States/UTs which will
decrease the discrepancy. More number of surveys should be done to get the latest
data on States/UTs.
Conclusion
India
played an important role in the formulation of 17 sustainable development
goals. Sustainable Development provides a framework which brings together
economic, social and environmental consideration. The aim of the SDG is human
dignity, regional and global stability, a healthy planet, fare and resilient
societies and prosperous economies.
NITI
Aayog in partnership with various government institutions is working on
achieving the target goal of the year 2030. Partnership growing at the
international, national and sub-national levels is beneficial for the progress
of SDG. NITI Aayog has come up with initiatives that have succeeded owing to
the strength of the partnerships.
Indian
States/UTs are working on the raw data required for analysis of goal-wise
performance. Partnership at various government tiers will help India to face
the challenges and analyse the goal performance more accurately.
Reference
- United Nations. (2018). The Sustainable Development Goals Report. Japanese Journal of Health Education and Promotion, 19(1), 77–82. https://doi.org/10.11260/kenkokyoiku.19.77
- United Nations & Niti . (2018). INDEX.
- United Nations & Niti . (2019). SDG India Index and Dashboard 2019. 181. https://niti.gov.in/sites/default/files/2019-12/SDG-India-Index-2.0_27-Dec.pdf
- United Nations & Niti . (2021). SDG India Index. 48. https://niti.gov.in/writereaddata/files/SDG_3.0_Final_04.03.2021_Web_Spreads.pdf
- NITI. SDG India index. SDG India index & Dashboard 2020-21Partnerships in the decade of action. [Online] [Cited: July 21, 2021.] https://sdgindiaindex.niti.gov.in/#/ranking.
Related Articles


TOWN AND COUNTRY PLANNING ACTS- A CRITICAL ANALYSIS OF THE HARYANA DEVELOPMENT AND REGULATION OF URBAN AREAS ACT, 1975
 SHREYA JAISWAL