AVAILABILITY OF PUBLIC TRANSPORTATION: IMPORTANT IN DEVELOPING CITIES - By MITASHA DUGGAL

India, one of the fastest-growing economies in
the world, is achieving a growth rate of 7.5% per annum. With a growing
population too, the country is working hard to transform itself over the next
few decades. As per 2011
census, 31.2% of India’s population (377 million) is living in urban areas. As
the UN estimates, these numbers will grow to 40% (590 million) by 2030 and 58%
(875 million) by 2050. While only 30% of the total population lives in urban
areas, approximately 63% of India’s Gross Domestic Product (GDP) is contributed
by those urban areas.
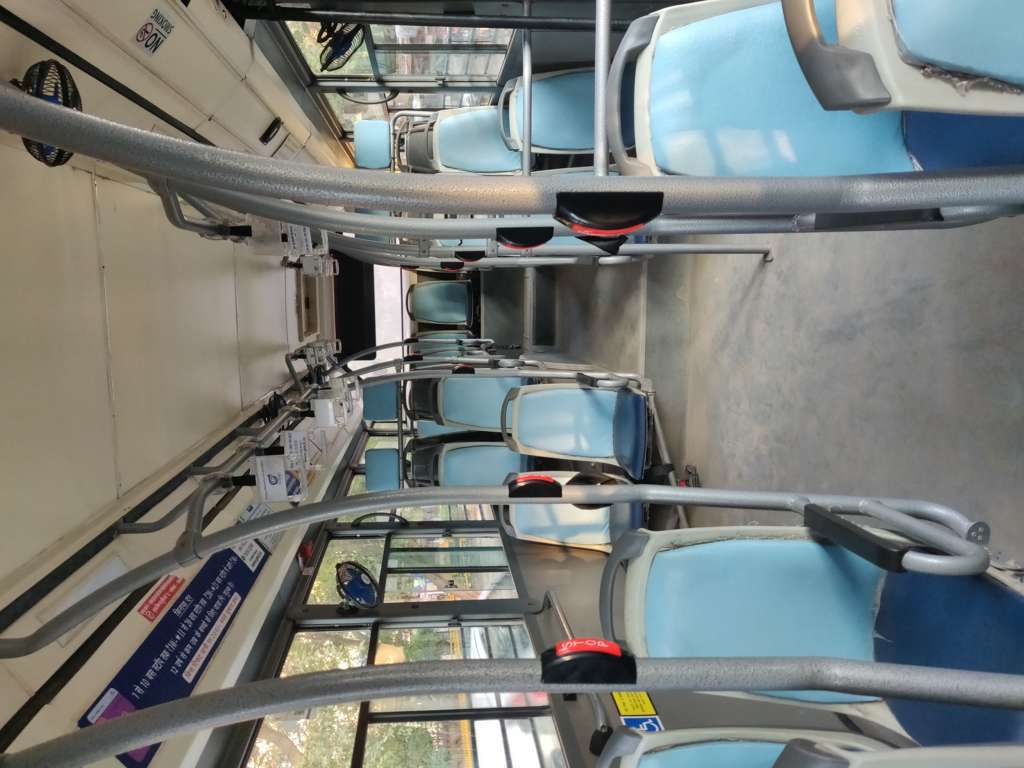
Public
transportation systems include a variety of transit options such as buses,
light rail, and subways. These systems are available to the public, may require
a fare, and run at scheduled times. The purpose of introducing or expanding
public transportation is to increase access to and use of public transit while,
at the same time, reducing motor vehicle miles were driven and traffic congestion.
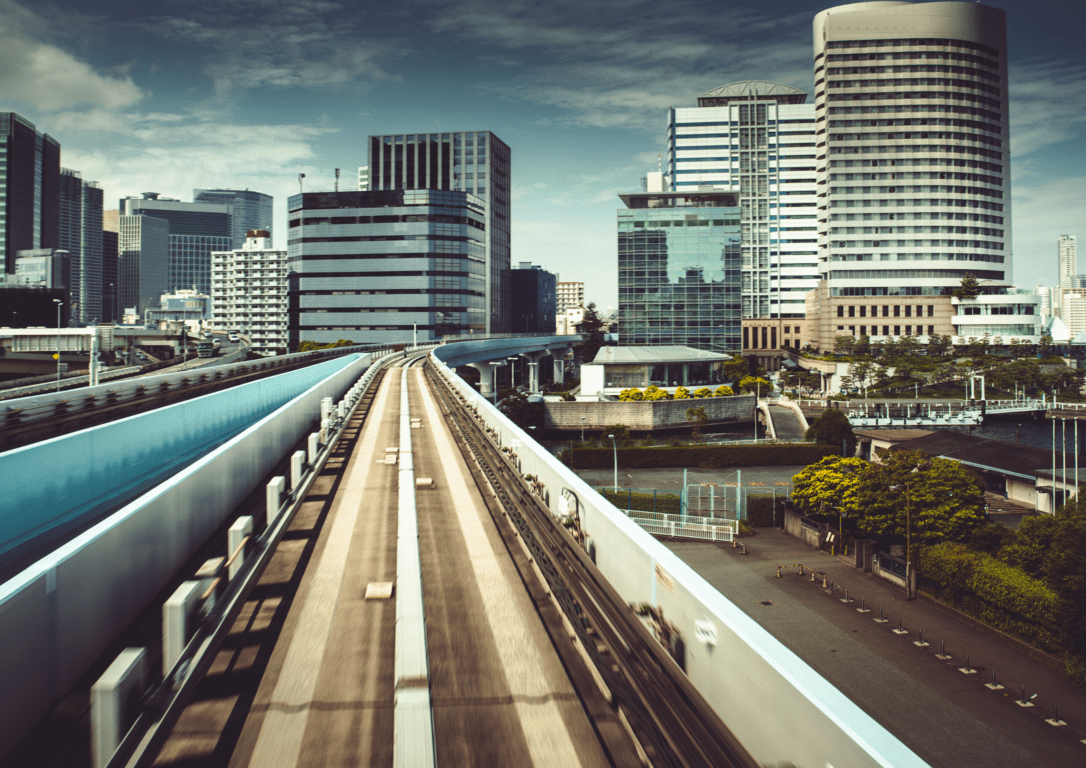
Indian cities
rely predominantly on buses and trains for public transport, and are likely to
continue to do so for years. However, the public bus transit service is inadequate
and unaffordable for the urban poor. The situation, and the
ability to address it, are worse in the secondary cities than the metropolitan
centers.
Availability of motorized transport increases household income, and
increases in commercial and industrial activities have further added to
transport demand. In many cases, demand has outstripped road capacity. Greater
congestion and delays are widespread in Indian cities and indicate the seriousness
of transport problems
Transportation and are underutilized as per the capacity required. To
understand the travel pattern of a city the most important analysis is the number
of trips, which is determined using factors such as trip generation, trip
attraction, trip demand, and population data. Trip generation is determination
of rip, generation is performed by relating the number or frequency of trips to
the characteristics of the individuals, of the zone, and of the transportation
network, while trip distribution is the linking of trip origin and destinations.
The interaction of any two points through these trips in current existing
scenario and in the future upcoming will show how these trips will increase or
decrease and also will help in enabling
and marking a public transport route map of any city.
Effective transportation networks that incorporate public transit help
lower a city’s per capita carbon footprint, and make cities more liveable by
easing commute and transportation needs and increasing accessibility. However,
the mere presence of public transportation—the number of buses, trains,
trolleys, and trams available—do not paint a complete picture.
Bus services, in particular, have deteriorated, and their relative output
has been further reduced as passengers have turned to personalized modes and
intermediate public transport. Public transportation systems
provide opportunities for increased physical activity in the form of walking or
biking on either end of the trip (e.g., from home to bus stop or from the train
stop to the office) and reduced motor vehicle travel. Despite these benefits, many people
view walking and bicycling within their communities unfavorably because of
barriers such as disability, age, chronic disease, inconvenience, or safety
concerns about traffic and a lack of sidewalks, crosswalks, and bicycle
facilities.
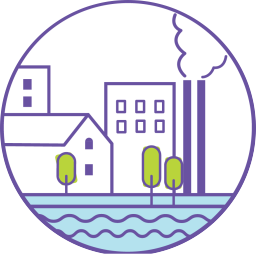
A high level of pollution is another undesirable feature of overloaded
streets. The increase in the number of cars and bikes has added to various
pollution problems. The smoke emitted from vehicles has made the cities living
gas chambers. The new policies of economic liberalization have opened doors for multinationals and the cars of various companies have become status symbols
of the upper-middle class. The amount of harmful gases in the air is alarmingly
on the rise. They affect our eyes and lungs, giving rise to all kinds of
cardiovascular and respiratory diseases. Using public
transport would definitely save fuel, reduce harmful gas emissions, further
reducing one’s carbon footprint, and eventually the causes and effects of global
warming.
Let`s take Indore city, for example, Indore is a city in the state of Madhya Pradesh,
known as a business and start-up hub also
emerging as an education center of the city as it has both NIT and IIM including
many other technical colleges. In addition, it has been ranked as India's
cleanest city four years in a row as per the Swachh Survekshan for the
years 2017, 2018, 2019, and 2020. Indore is also one of the 100 smart cities
and developing rapidly. Indore city is linked by three modes of
transportation viz. Road, Rail, and Air. Its regional road pattern fans out in
all directions. The National Highway (Mumbai-Agra Road) passes through the
city's habitat area. State Highways and other roads connect the city with State
Capital Bhopal, all District Head Quarters of the Division, and important towns
within the District. A broad-gauge and
meter-gauge railway line serve the city. The Railway line passes through the
heart of the city, which forms a physical barrier for, intercommunications
within the city. The city is also served by a regular air service with
connects it to Mumbai, Bhopal, and New Delhi.
As per the 2011 census, the city of Indore has a population of 19, 94,422 lakhs. The density of the city was 9,718 PERSON/SQ.KM.While
the trips per day are 55,000 with a per capita rate of 1.7 trips and the travel
demand are 21,91,664.More than 10% growth in Private-owned vehicles has
resulted in a 60% increase in traffic congestion and deteriorating air quality.
Barring AICTSL services, public transport is poor with only 0.045 populations.
This means we need public transportation services that can connect to each
locality and to the outskirts of the city.
In addition, also, if we talk about a metropolis
like Chennai, Chennai, located on the coast of the Bay of Bengal, It is the
capital of Tamil Nadu State. It is the fourth largest metropolitan city in the country. Chennai is
well connected with traffic. It is one of the cities in India connected by the
golden quadrilateral system of national highways. Chennai International Airport
is the third busiest airport and the second busiest cargo terminal in India’s
area. The city also has three main ports.
In 2011, there were 4,646,732 Population (according to the census).
Judging from the registration information of vehicles and the characteristics
of the road network of vehicles, there were 3.42 million registered vehicles in
2011. Travel trip rate 1.6 Business trips every day. Motorization rate is
737/1000pop. The total number of buses is 3688, of which private operators
provide 70. In addition, the city has 66,679 cars and 2,000 shared cars, while
there are no rickshaws in operation in the city. The city mainly lacks non-motorized
vehicles connecting different areas, and people rely on their own private
transportation for daily commuting.
This
shows that it is necessary to promote public transportation rather than private
vehicles. This requires not only increasing the quantity and quality of public
transportation, but also effective use of demand and supply management
measures. Should also encourage people to use non-motorized vehicles and invest
in them to make them safer. Cities are the largest contributors to economic
growth, and mobility between cities is essential to improve quality of life.